
Pour Cost Calculator: Price Every Drink Your Bar Pours
Pour cost is what the alcohol in a drink costs you, divided by its menu price. Enter a bottle or keg size, what you paid, and your pour, and this pour cost calculator returns cost per ounce, cost per drink, pour cost %, and the menu price that hits your target, for spirits, cocktails, wine by the glass, and draft beer.
Calculate now ↓A drink cost calculator for every pour on your bar menu
Suggested menu price
$8.50On target · 19.5% pour cost
- Cost per ounce
- $1.10
- Cost per drink
- $1.66
- Pours per bottle
- 16
- Profit per drink
- $6.84
- Gross margin
- 80.5%
- Markup
- 5.13×
- Profit per bottle
- $109.50
- Pour cost after rounding
- 19.5%
Show the math
$28.00 ÷ 25.36 oz = $1.10 per oz → 1.5 oz × $1.10 = $1.66 → ÷ 20% → rounded to $8.50
Recipe (theoretical) cost. Real cost also includes comps, spills and over-pours.
Happy hour check
Over-pour check
Your drink list
Saved in this browser for 30 days. Download a CSV to keep a copy.
- One liquor cost calculator
- 4 drink types
Spirits, cocktails, wine by the glass, and draft beer sit in one tool, so you don’t need a separate calculator for every drink.
- Works in both directions
- Price ⇄ pour cost
Set a target percentage to get a menu price, or enter the price already on your menu to see its pour cost.
- See the margin a deal takes
- Happy hour check
Check what a discount or an extra quarter ounce does to profit per drink before new prices reach the menu.
How to Calculate Pour Cost on One Drink
Pour cost equals the cost of the pour divided by the menu price, times 100, and the pour cost calculator above runs it in three steps: cost per ounce, cost per drink, and then the percentage. The same math answers how to calculate liquor cost per drink by hand:
- Cost per ounce = bottle cost ÷ ounces in the bottle. A 750 ml bottle holds 25.36 oz.
- Cost per drink = cost per ounce × ounces poured, plus mixer and garnish.
- Pour cost % = cost per drink ÷ menu price × 100.
| Step | Bourbon, 1.5 oz neat |
| Bottle | 750 ml at $28 |
| Cost per ounce | $1.10 |
| Cost per 1.5 oz pour | $1.66 |
| Menu price | $8.50 |
| Pour cost | 19.5% |
| Profit per drink | $6.84 |
A 1.5 oz pour of 80-proof spirits is one US standard drink, as defined by the National Institute on Alcohol Abuse and Alcoholism (NIAAA). On paper, a 750 ml bottle gives 16.9 such pours, but a bar can only sell whole drinks, so the calculator counts 16. In addition, the waste field removes spills and tastings from the ounces you can actually sell. The formula never changes from drink to drink, only the inputs do.
Five Worked Examples: Shot, Highball, Cocktail, Wine, and a Draft Pint
Each example below runs the same three steps with different containers, so you can check the pour cost calculator’s answer against your own math. The prices are example invoice prices, not market quotes; swap in your own.
| Drink | Inputs | Cost per drink | Target | Menu price | Actual pour cost | Profit |
| Bourbon, 1.5 oz | 750 ml at $28 | $1.66 | 20% | $8.50 | 19.5% | $6.84 |
| Well vodka soda | 1 L at $14, 1.5 oz, $0.25 soda and lime | $0.87 | 18% | $5.00 | 17.4% | $4.13 |
| Margarita | Tequila, triple sec, lime, agave, salt | $2.97 | 22% | $14.00 | 21.2% | $11.03 |
| House wine, 6 oz | 750 ml at $12 | $2.84 | 28% | $10.50 | 27.0% | $7.66 |
| Draft pint, 16 oz | Half barrel at $180, no loss | $1.45 | 22% | $7.00 | 20.7% | $5.55 |
Containers change the result more than recipes do. When the same keg loses 10% to foam and line cleaning, a pint costs $1.61 instead of $1.45, and beer pour cost at the same $7.00 price rises from 20.7% to 23.0%. A drink cost calculator that ignores the loss makes draft look cheaper than it is. The next question is how a percentage turns into a markup.
Liquor Markup, Profit Margin, and the Menu Price
Pour cost, markup, and margin are one number seen three ways: a 20% pour cost equals a 5× markup and an 80% gross margin, so the same tool works as a liquor markup calculator and a liquor profit margin calculator.
| Pour cost | Markup on cost | Gross margin |
| 15% | 6.67× | 85% |
| 18% | 5.56× | 82% |
| 20% | 5.00× | 80% |
| 22% | 4.55× | 78% |
| 25% | 4.00× | 75% |
| 28% | 3.57× | 72% |
| 30% | 3.33× | 70% |
As a liquor pricing calculator, the tool divides cost by your target and rounds the price up to the next $0.25, $0.50, $1.00, or .99 ending, so rounding never pushes you above target. After rounding, it shows the actual percentage, which is often a point lower. However, a lower percentage doesn’t always mean more money. A premium bourbon at 28% can earn more dollars per drink than a well pour at 15%. That is why bars aim for a blended average across the whole menu instead of one number for every bottle. So what number is reasonable for each type of drink?
Target Ranges by Drink Type
There is no single right pour cost: spirits usually run lowest, wine by the glass runs highest, and the calculator colors each result against the range for the tab you’re on. Pour costs differ by drink type, and industry guides don’t agree on exact numbers, so the table shows both the working target the calculator uses and the spread across published bar-industry guides.
| Drink type | Working target in the calculator | Range across industry guides |
| Spirits | 18–20% | 15–24% |
| Cocktails | 18–24% | 18–24% |
| Draft beer | 20–24% | 18–28% |
| Bottled and canned beer | 24–28% | 23–30% |
| Wine by the glass | 28–32% | 26–40% |
| Whole bar, blended | 20–24% | 18–25% |
Wine runs higher because an opened bottle lasts only a few days, and every glass poured down the sink at close raises the cost of the glasses that sold. Draft runs lower because an ounce from a keg costs less than an ounce from any bottle. Neighborhood bars and premium menus usually sit at the top of each range, while high-volume bars sit at the bottom.
“Every drink on the menu should hit the same pour cost.” Not quite: one flat percentage either overprices the well or underprices the top shelf, and wine by the glass can’t reach a spirits target without losing guests.
Cocktails are where the range is hardest to hit, because the cost is spread across several lines.
Cocktail Pricing Calculator: Cost Every Ingredient
A cocktail’s cost is the sum of each ingredient’s ounces times its cost per ounce, plus garnish, and the Cocktail tab of the pour cost calculator adds those lines and prices the drink at your target. Enter what each bottle or juice costs and how much goes into the glass; the cocktail cost calculator does the rest.
| Margarita ingredient | Line cost | Share of cost |
| Tequila, 2 oz (750 ml at $26) | $2.05 | 69% |
| Triple sec, 1 oz (750 ml at $12) | $0.47 | 16% |
| Fresh lime juice, 1 oz | $0.30 | 10% |
| Agave syrup, 0.5 oz | $0.10 | 3% |
| Salt rim | $0.05 | 2% |
| Total at a 22% target | $2.97 | Menu price $14.00 |
The lime, syrup, and salt make up 15% of this drink’s cost. Skip them, and the margarita looks like an 18.0% drink instead of a 21.2% one, a gap of more than 3 points on every glass. House-made syrups, dashes of bitters, specialty ice, and garnishes all belong on the list. For batched cocktails, cost the whole batch per liter first, then divide by the number of servings it yields. Wine and beer, however, start from a different container.
Pours per Bottle and Keg
Every container becomes ounces first: a 750 ml bottle holds 25.36 oz, which is 16 full 1.5 oz pours or four 6 oz glasses of wine, and a half barrel of beer holds 124 sixteen-ounce pints. That is how the beverage cost calculator handles wine and draft beer from the same starting point as spirits, and how the liquor cost calculator counts full pours.
| Bottle size | Ounces | Full 1.5 oz pours |
| 50 ml | 1.69 | 1 |
| 375 ml | 12.68 | 8 |
| 700 ml | 23.67 | 15 |
| 750 ml | 25.36 | 16 |
| 1 L | 33.81 | 22 |
| 1.75 L | 59.17 | 39 |
| Keg | Ounces | 16 oz pints | 12 oz pours |
| Half barrel (15.5 gal) | 1,984 | 124 | 165 |
| Quarter barrel | 992 | 62 | 82 |
| Sixth barrel (5.16 gal) | 661 | 41 | 55 |
| 50 L | 1,690.7 | 105 | 140 |
The 700 ml size sits in the list because the Alcohol and Tobacco Tax and Trade Bureau (TTB) added it, among 15 new spirits sizes, to the US standards of fill on January 10, 2025, so more imports now arrive in it. A wine pour cost starts from 5 glasses at 5 oz, the NIAAA standard glass of 12% wine, or 4 at 6 oz per bottle. The Brewers Association’s Draught Beer Quality Manual recommends cleaning draft lines about every two weeks, and clean lines pour less foam, so more of each keg reaches a glass. Containers set the base cost; however, two habits behind the bar quietly change it.
Happy Hour and Over-Pouring: Two Hidden Price Cuts
A happy hour discount and an extra quarter ounce both raise pour cost the same way a lower menu price does, and the drink price calculator shows each one in dollars before it reaches the menu.
Happy hour. Dropping the bourbon from $8.50 to $6.00 moves its pour cost from 19.5% to 27.6%. Profit per drink falls from $6.84 to $4.34, so the bar has to sell 1.58 happy hour drinks to earn what one full-price drink earns. Seven states, including Massachusetts and Utah, still ban happy hour outright, and others cap its hours or discount. Indiana, for example, has allowed it since July 1, 2024, for no more than four hours a day.
Over-pouring. A 1.75 oz free pour on a 1.5 oz recipe adds 16.7% to every drink. At the same $8.50 price, pour cost climbs to 22.7%, and the bottle gives 14 drinks instead of 16: $4.00 of product and $20.53 of missed sales per bottle. At 100 spirit drinks a night for 26 nights, the extra liquor comes to about $718 a month.
Bars that run happy hour prices on the bar’s menu screen in Decker switch the discount on schedule, so it ends at the minute it should. One drink, however, is only the recipe; the whole bar tells a different story.
Recipe Cost vs What the Bar Actually Pours
The per-drink numbers are your recipe, or theoretical, cost; your actual cost comes from an inventory count, and the Whole bar tab works as a beverage cost percentage calculator that turns the gap into dollars. The per-drink math cannot see spills, comps, or free pours, but the inventory can.
-
Step 1.
Count opening stock
Weigh or estimate every open bottle to the tenth, and record the value of everything behind the bar at the start of the period.
-
Step 2.
Add every invoice
Total all liquor, beer, and wine purchases for the period, including deliveries that arrived mid-week.
-
Step 3.
Count closing stock the same way
Use the same method and the same person or scale, so the two counts compare cleanly.
-
Step 4.
Divide by beverage sales
Opening stock plus purchases minus closing stock, divided by beverage sales from the POS, gives the actual percentage. For example, $8,000 + $6,500 − $7,200 = $7,300 used, against $30,000 in sales, is 24.3%. Against a 20% target, that 4.3-point gap is about $1,300 a month, or $15,600 a year.
Six Ways to Cut Liquor Cost Behind the Bar
High pour costs usually come from a handful of fixable habits, and each card below targets one of them.
-
Jigger every pour
Free-pour counts vary from one bartender to the next and from one spout to another. The Over-pour check shows what a quarter ounce costs per bottle, which makes the case for jiggers better than any memo.
-
Count the top bottles weekly
A weekly count of the 10–20 bottles that sell most catches a leak in seven days instead of thirty. Full counts can stay on a longer cycle.
-
Ring in every comp
A comped drink belongs in cost but brings no sales. When nobody rings it in, it looks exactly like an over-pour in the numbers.
-
Clean draft lines every two weeks
Clean lines pour less foam, so more of each keg reaches a glass. Cleaning every two weeks is the Draught Beer Quality Manual’s recommendation.
-
Re-cost after every price increase
When a distributor raises a bottle price, enter the new cost and get the new menu price in seconds. A price that stays the same for a year is a pour cost that drifts up.
-
Put high-margin drinks first
Guests order what they see first. Placing high-margin drinks at the top of the list sells more of them without changing a single price.


From the Calculator to the Menu Behind the Bar
New prices work only when the screen, the POS, and the printed list agree, so the last step is getting the calculator’s numbers onto the menu guests read.
-
Step 1.
Price the whole list
Add every drink to the drink list in the calculator and check the bar’s blended pour cost before anything changes.
-
Step 2.
Export the list
Download it as a CSV that opens in Excel or Google Sheets, or build your bar’s menu in Decker from it.
-
Step 3.
Let the screen follow the register
On digital menu boards synced with your POS, a price you change at the register reaches the screen in 1–5 seconds, and happy hour switches on schedule. Start from bar and drink menu templates or any of the menu templates.
Related Scenarios
-
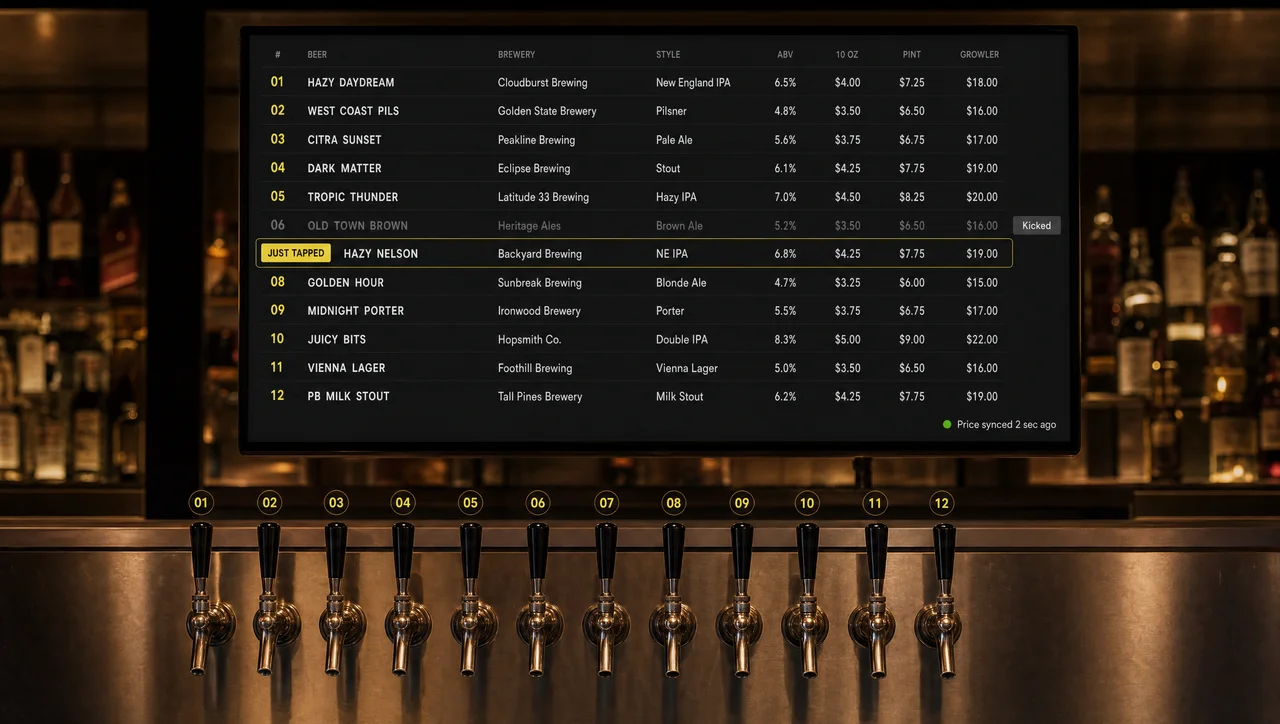 Learn more
Digital Menu Boards for Bars
Tap lists and drink prices from your POSBeer, cocktail, and wine prices that change at the register show on the screen behind the bar.
-
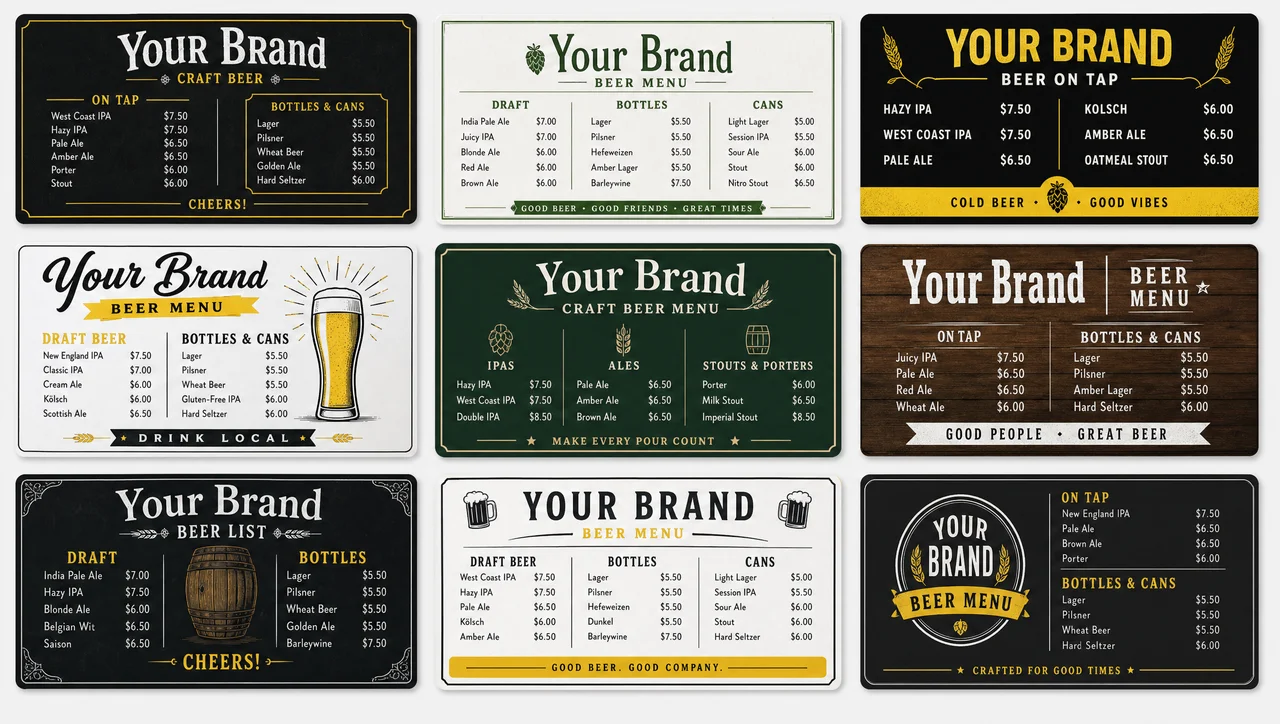
Bar and Drink Menu Templates
Layouts for cocktails and happy hourStart a drinks list from a ready layout instead of designing it from scratch.
-
Cocktail Menu Templates
Signature drinks with prices that fitCocktail list layouts with room for ingredients, glass type, and price.
-
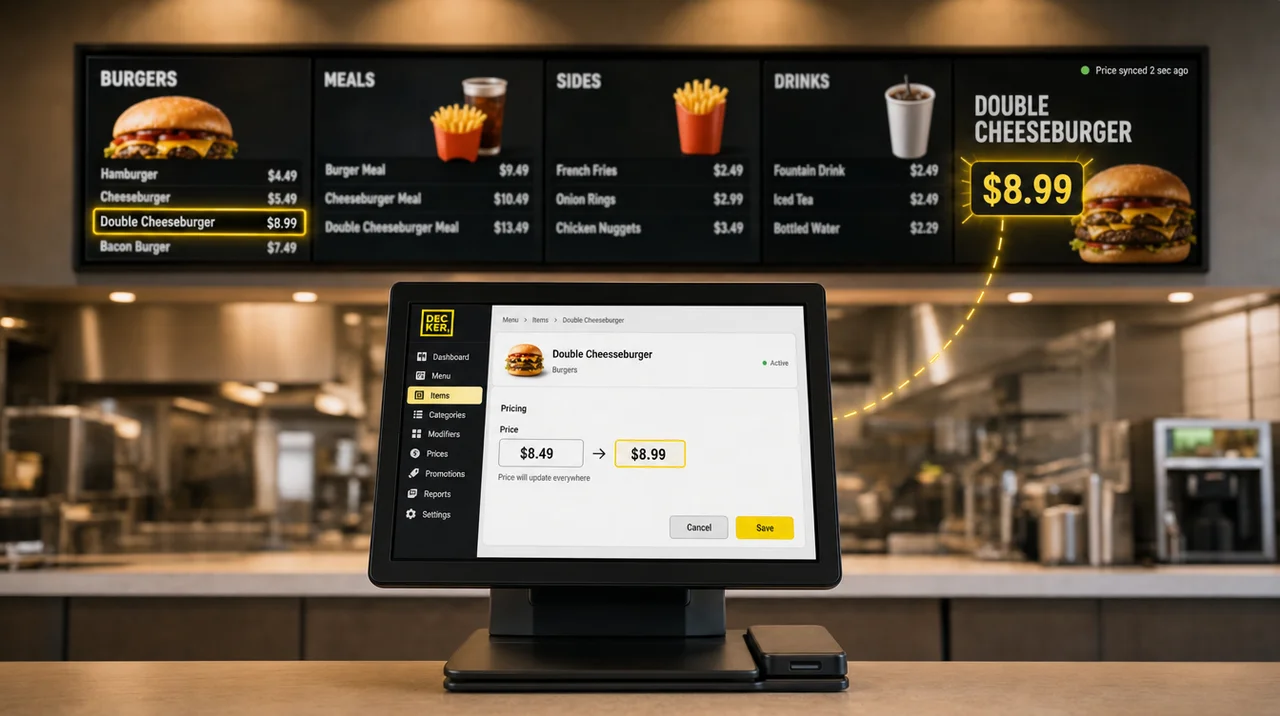 Learn more
POS-Synced Menu Boards
The register sets the price on screenPrices and sold-out items move from Toast, Square, or Clover to every menu screen.
-
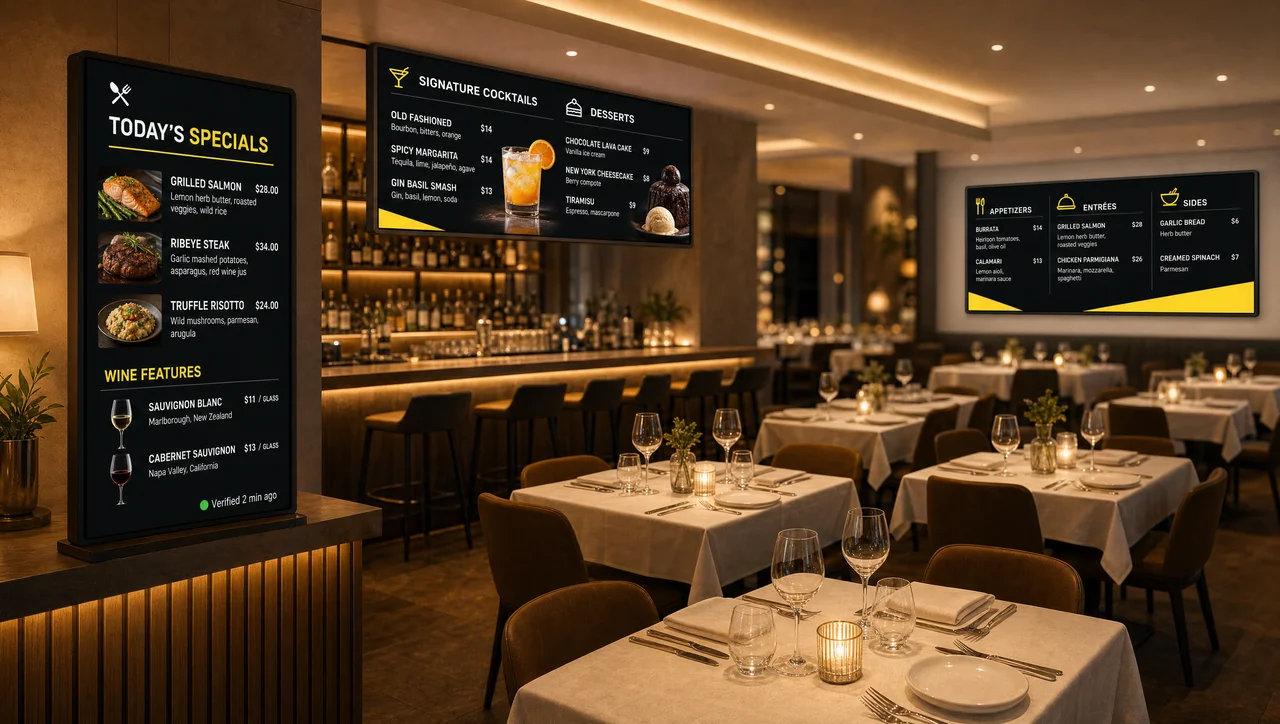 Learn more
Digital Menu Boards for Restaurants
Food and drinks on one menu wallMenu screens for restaurants that serve a full bar next to the kitchen menu.
Bar Drink Cost FAQ
What is a good pour cost for a bar?
Most bars work with 18–20% for spirits, 20–24% for draft beer, 28–32% for wine by the glass, and 20–24% for the bar as a whole. The right number depends on the concept: a high-volume bar runs lower, and a wine bar runs higher. Blended pour costs that stay above 30% month after month usually point to over-pouring, unrung comps, or prices that never caught up with invoices.
How do you calculate a 20% pour cost?
Divide the cost of the drink by 0.20. A bourbon pour that costs $1.66 needs at least $8.28 on the menu, which rounds up to $8.50 and lands at 19.5%. The same division works for any target: 0.18 for an 18% target, 0.25 for 25%.
How many 1.5 oz pours are in a 750 ml bottle?
A 750 ml bottle holds 25.36 oz, which is 16.9 pours of 1.5 oz on paper and 16 full drinks in practice, the number the pour cost calculator uses. At a 1 oz pour, the same bottle gives 25 drinks, and a 700 ml bottle gives 15 at 1.5 oz.
How many ounces is a standard pour?
In the US, a standard drink is 1.5 oz of 80-proof spirits, 5 oz of 12% wine, or 12 oz of 5% beer, according to NIAAA. Many bars still pour 1.25 oz or 2 oz of spirits, which is why the pour field accepts any size.
How many ounces is a 4-count pour?
Wine Enthusiast’s bartending guide puts one count at about half an ounce, which makes a 4-count pour about 2 oz. Counts depend on the spout and on the bartender’s rhythm, however, so the reliable way to know is to pour a count into a jigger once a week and enter the real number.
Should mixers, garnishes, and comps count in the cost of a drink?
Yes. Mixers and garnishes belong in the cost of each drink; in the margarita example, they make up 15% of it. Comps count in cost for the period, but not in sales, which is exactly why unrecorded comps push the actual number up.
How many pints are in a keg?
A half barrel holds 124 sixteen-ounce pints or 165 twelve-ounce pours, a quarter barrel 62 pints, a sixth barrel 41, and a 50 L keg about 105. Foam and line cleaning reduce how many of them reach a glass, so enter a loss percentage for a realistic beer pour cost.
How often should a bar take inventory?
Count the top-selling bottles every week and the full bar at least every two weeks. A monthly count only shows a leak 30 days after it starts, and by then a busy bar has poured hundreds of drinks at the wrong cost.
Does this calculator save my data?
Decker’s calculator runs in your browser, and nothing is sent anywhere while you type. The drink list stays on your device until you export it or send it to your email.
When does a bar not need a pour cost calculator?
A bar that sells fewer than ten drinks, buys them at prices that haven’t changed in a year, and already prints its costs on the recipe card gains little from a pour cost calculator. The same goes for a venue where drinks bring in less than a tenth of sales, such as a café with two beers in the cooler. A bar group that already tracks every bottle in inventory software, which pulls recipe costs from its POS, has the per-drink math built in. What it still needs is the count that compares that math with the stock behind the bar.
Put Your New Drink Prices on the Screen Behind the Bar
Take the list from the calculator to the menu screen: prices follow your POS, happy hour runs on schedule, and one screen stays free.


