How to Improve QSR Operations: Best Practices for Speed, Staff and Stores


To improve QSR operations, time speed of service by segment, fix order accuracy at the confirmation screen, staff the peaks, keep new hires past their first 90 days and run every store to one standard. Start with one metric in one store, then copy what works.
Quick service margins leave little room for a slow lane, and most QSRs feel it first at the drive-thru and the lunch counter. In the National Restaurant Association’s 2026 State of the Restaurant Industry report, 42% of operators said their restaurants were not profitable in 2025, and 60% reported lower traffic than a year earlier. With fewer guests and higher costs, the seconds, remakes and empty shifts inside each store decide whether it makes money.
This guide covers QSR operations only, the daily work that QSRs run between open and close: counters, drive-thru lanes, kiosks and pickup shelves, not table service. Each practice comes with the metric it moves, a way to check it within two weeks, and 2026 data on drive-thru performance, labor and technology. Next come the four numbers that define QSR operations.
What Are QSR Operations?
QSR operations are the repeatable work that turns an order into food in the guest’s hand: taking the order, making it, handing it over and doing it the same way in every store. Quick service restaurant operations differ from full-service restaurant operations in one way that shapes everything else: there is no table to slow the guest down. The guest waits in a line, a lane or at a pickup shelf, and every second shows. The QSR meaning, with examples of quick service brands, has its own guide; this one assumes you already run a store.
QSR operations and other fast food operations rest on four numbers, and fast food restaurant operations management is mostly the work of keeping them in balance. QSRs track each of them in a different system:
| Metric | What it measures | Where the data comes from | 2026 reference point |
|---|---|---|---|
| Speed of service | Time from first contact to food in hand | Drive-thru timers, POS timestamps, kitchen display | Median drive-thru visit under 4:25 (Intouch Insight) |
| Order accuracy | Share of orders delivered exactly as ordered | Complaints, remakes, refunds, mystery shops | 89.3% across 13 US chains (Intouch Insight) |
| Labor | Labor cost as a share of sales, orders per labor hour | POS sales and the schedule | Your own baseline, by daypart |
| Consistency | Same menu, prices, standards and working screens in every store | Audits, POS reports, screen reports | Gap between your best and worst store |
What Affects Restaurant Operational Efficiency
Six restaurant operations challenges cause most of the lost seconds and dollars in a quick service store. If you are asking what can affect the restaurant operational efficiency of a QSR, start with this list:
- Peaks staffed like average hours.
- A menu too long for the daypart, so the kitchen builds items it rarely makes.
- New crew members working stations they have not learned yet.
- Equipment and screens that fail during service.
- Prices and sold-out items that differ between the POS, the menu board and the delivery apps.
- Stores of one brand that run to different standards.
Each one maps to a practice below. Fix them in the order your data shows, not the order they appear here. Next come the eight practices that address them.
How to Improve QSR Operations: 8 Best Practices
The fastest way to improve QSR operations is to fix one bottleneck at a time, measure it for two weeks, then copy what worked to the next store. Most best practices in restaurant operations are written for full-service dining, with table turns and reservation pacing. The eight below are built for counters, lanes and pickup shelves.
| # | Practice | Metric it moves | Effort | When you see it |
|---|---|---|---|---|
| 1 | Time speed of service by segment | Speed of service | Low: timer or POS reports | First week |
| 2 | Fix the drive-thru board and window | Drive-thru total time | Medium | 2–4 weeks |
| 3 | Cut order errors before the kitchen | Order accuracy | Low to medium | 2 weeks |
| 4 | Staff for peak hours | Speed at peak, labor % | Medium | 2–4 weeks |
| 5 | Match the menu to the daypart | Speed at peak, check size | Medium | 2–4 weeks |
| 6 | Keep sold-out items and prices in sync | Accuracy, refunds | Low with a POS integration | Days |
| 7 | Keep new hires past 90 days | Turnover, training hours | High, ongoing | 1–3 months |
| 8 | Run every store to one standard | Consistency between stores | Medium, ongoing | 1–3 months |
Improving restaurant operations in a quick service store rarely needs a new concept. Restaurant efficiency at a counter means fewer wasted seconds per order and fewer remakes per shift. The answer to how to improve restaurant efficiency, or how to improve QSR operational efficiency in a chain, comes down to the same loop: pick the weakest metric, change one thing, then compare the two weeks before and after. That loop is also how to improve restaurant operations efficiency without a consultant and increase restaurant efficiency one store at a time, and it is the safest of the ways to improve restaurant efficiency across a brand, because a pilot store absorbs the mistakes.
Practices 1 to 3 are covered in the speed and drive-thru sections, and 7 and 8 have sections of their own. The four that change daily store routines come first, because they decide how well you can improve restaurant operations from the next shift on.
Staff for Peak Hours, Not the Average Hour
Restaurant efficiency tips during peak hours start with the schedule: staff the lunch rush by a 15- or 30-minute forecast, not by the average hour. An average hour hides the 45 minutes that set speed of service for the whole day.
- Forecast from POS history in 15- or 30-minute intervals, by daypart and weekday.
- Give each peak role one job: order taker, runner, window, or line-buster with a tablet.
- Prep sauces, cut produce and stage packaging before the rush, not during it.
- Keep the manager on the floor at peak, not in the office.
- Cross-train at least two people for every station, so one sick call does not close it.
Forecasting pays off fastest when the kitchen screens use it. Wingstop’s Smart Kitchen, a kitchen display system with predictive order management, cut ticket times from 18–22 minutes on the chain’s best days to about 10 minutes. Guest satisfaction rose eight points against restaurants without it, and by July 2025 the system ran in at least 1,000 restaurants. A high throughput QSR workflow works the same way at any size: cook to the forecast before the orders arrive. Track labor as a share of sales by daypart rather than by week, because a week can look on target while every lunch is short-staffed and every 3 p.m. is overstaffed.
Match the Menu to the Daypart
Daypart optimization in QSR brands means showing a shorter, faster menu in each part of the day, so the board sells what the kitchen can make quickly right now. Breakfast, lunch, the afternoon dip, dinner and late night each need a different menu length and a different board.
What to change by daypart:
- Items: drop slow builds from the peak menu.
- Order on the board: put the fastest combos at the top.
- Promotions: feature the item the kitchen has staged, not one it has to start from scratch.
- Prep and staffing: match both to the menu for that hour.
McDonald’s suspended all-day breakfast in 2020 to simplify kitchen operations and speed up service, which shows how much a single menu decision moves throughput at scale. Daypart menus fail when someone has to switch them by hand during service. With menu board software that runs on a schedule, the breakfast board leaves the screen at 10:30 without a crew member touching it. Decker switches menus by daypart, weekday and opening hours from one schedule.
Keep Sold-Out Items and Prices in Sync on Every Screen
An item marked sold out at the register has to leave every screen, kiosk and delivery app at the same time, or guests keep ordering food the kitchen cannot make. In QSR slang the item is 86’d. In operations terms it becomes a refund, a remake or a longer wait at the window.
The 86 list should flow from the POS to the kitchen display, the self-order kiosk, the online menu, the delivery apps and the menu boards. It breaks most often on boards designed as images and uploaded as files, because nobody re-exports an image in the middle of a rush.
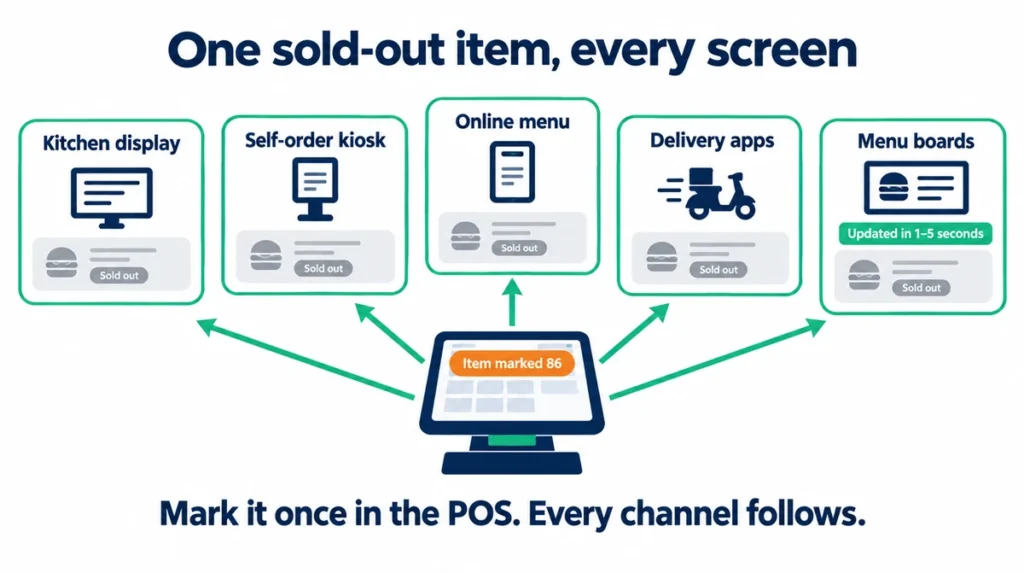
Decker reads items, prices and availability from Toast, Square, Clover or a spreadsheet. A price changed in the POS appears on the board in 1–5 seconds, and an item marked 86’d leaves the screen. With menu boards that sync with the POS, the price on the board and the price on the receipt stay the same number. Test it in five minutes: mark one item sold out in the POS, then check the kiosk, the online menu, the delivery app and every board.
“The crew will just tell guests it’s sold out” costs more time than it saves. In the drive-thru, the guest has already chosen from the board before reaching the speaker, so every sold-out item the board still shows turns into a second round of ordering at the busiest point in the lane.
Automate Repetitive Work, Then Check the Results
Restaurant operations automation pays off on tasks that repeat every shift, such as price changes, peak order taking and timers, and only after the manual process works. Good candidates are kiosks and mobile ordering, automatic menu updates from the POS, schedule forecasting and drive-thru timers.
QSRs test voice AI at the speaker more than any other of these QSR automations, and its public results vary. In Intouch Insight’s 2026 drive-thru study, order accuracy at AI locations rose to 90.8% from 82.5% a year earlier, and suggestive selling ran 20 points above the same brands without AI. Yet nearly three in ten guests repeated part of their order, and total time was 5:14 against 5:15 at the same brands’ other lanes. McDonald’s ended its automated order-taking test with IBM, run in about 100 restaurants, in 2024. Wendy’s planned to bring its FreshAI drive-thru ordering to more than 500 restaurants in 2025.
If the automation runs through the POS, check the POS first: list which kiosks, menu boards and delivery apps it already connects to before you add anything on top.
“Automate first and fix the process later” only automates the mistakes. In the 2026 Intouch data, AI raised accuracy and upsell attempts but left total time almost unchanged, because the lane, the kitchen and the window still set the pace.
Beyond daily routines, two numbers decide whether these changes stick: speed of service and order accuracy.
Put Every Menu Change on a Schedule
Set the breakfast board, the lunch board and the sold-out list once. Next time a price changes, every screen follows the POS. Decker’s 30-day trial covers up to five screens with no card required. Try Decker free
How to Improve Speed of Service in a QSR
Speed of service in a QSR is the time from the guest’s first contact to food in hand, and you can only improve it after you split that time into segments. At the counter, the segments are the line, the order, payment and the wait at the pickup shelf. For mobile orders, the gap between the promised and the actual ready time is the number to watch.
How to improve speed of service in restaurant counters comes down to one routine: time each segment for 20 guests at peak, find the longest one, and fix only that.
- Long line, short order: open a second register or a kiosk at peak.
- Long order: guests struggle to read the board, or modifiers take too many taps.
- Long wait at the shelf: the kitchen runs behind the forecast, or one station carries too many tickets.
Check the same segment a week later, and keep the change only if that segment got shorter.
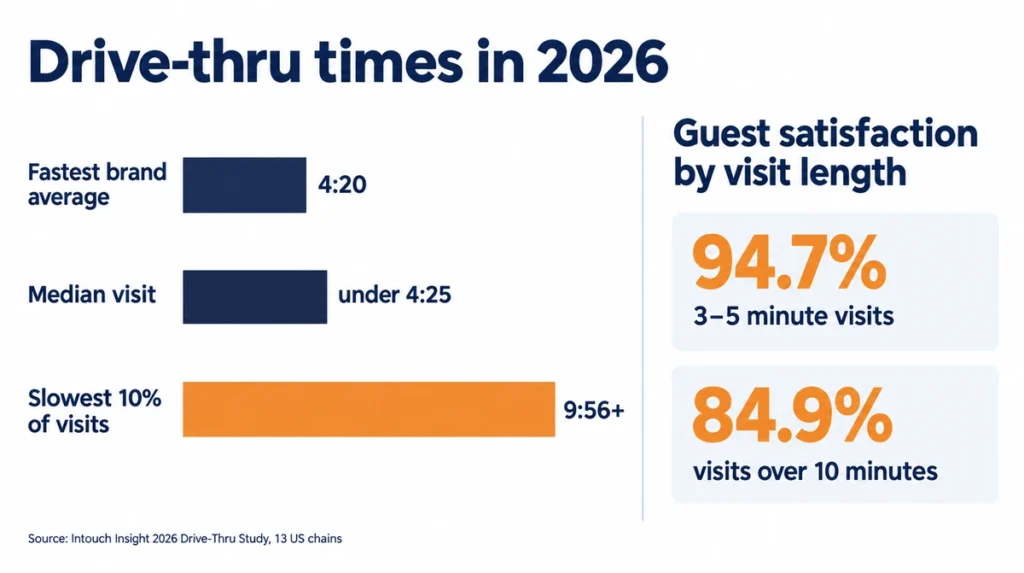
Speed of service, fast food’s oldest promise, matters because guests feel the difference before they see a clock. In Intouch Insight’s 2026 drive-thru study, satisfaction was 94.7% when a visit took 3–5 minutes and 84.9% when it took more than ten. In the faster group, 81.7% of guests would recommend the brand, against 60.4% in the slower one. QSR speed of service also follows the crew’s manner: visits with friendly service ran 25 seconds faster on average.
“Faster is always better” holds only while accuracy holds. In the same study, 43% of order errors came from customizations, the slowest orders to build. Rushing them trades a few seconds at the window for a remake and a refund.
How to Improve Order Accuracy
Order accuracy in a restaurant is decided before the kitchen sees the ticket: at the confirmation screen, in the modifier setup and in how the order is read back. Intouch Insight measured drive-thru order accuracy at 89.3% across 13 US chains in 2026, 2.4 points higher than in 2025, with the order confirmed on 85.3% of visits.
How to improve order accuracy in restaurant counters and lanes:
- Show the order on a confirmation screen, and read back every customized item.
- Set modifiers as required choices in the POS instead of free-text notes. A QSR POS rollout gives you the cheapest moment to rebuild them.
- Route each item to its station on the kitchen display, and check every bag at expo.
- Label pickup and delivery bags with the order number and the guest’s name.
- Let guests enter custom orders themselves on kiosks or in the app.
Check remakes every shift, and show the count at the pre-shift huddle so the crew sees whether the changes work.
Restaurant order accuracy also depends on what the guest saw first. A board that still shows a combo the POS no longer sells creates an error before anyone takes the order. That is why the drive-thru board comes next.
How to Improve Drive-Thru Speed of Service
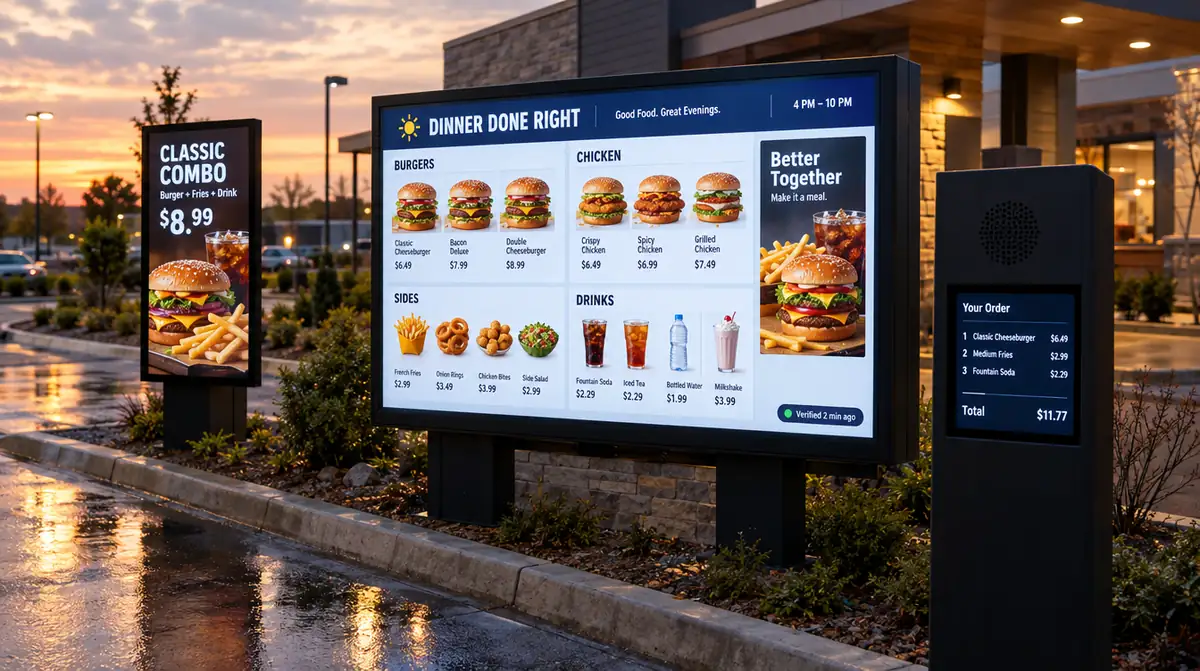
Most drive-thru seconds are lost at the menu board and the window, not in the kitchen, so improving drive-thru speed starts where the guest decides and pays. How to improve drive-thru speed of service comes down to five segments: the wait in the queue, the order at the speaker, the pull to the window, payment and handoff.
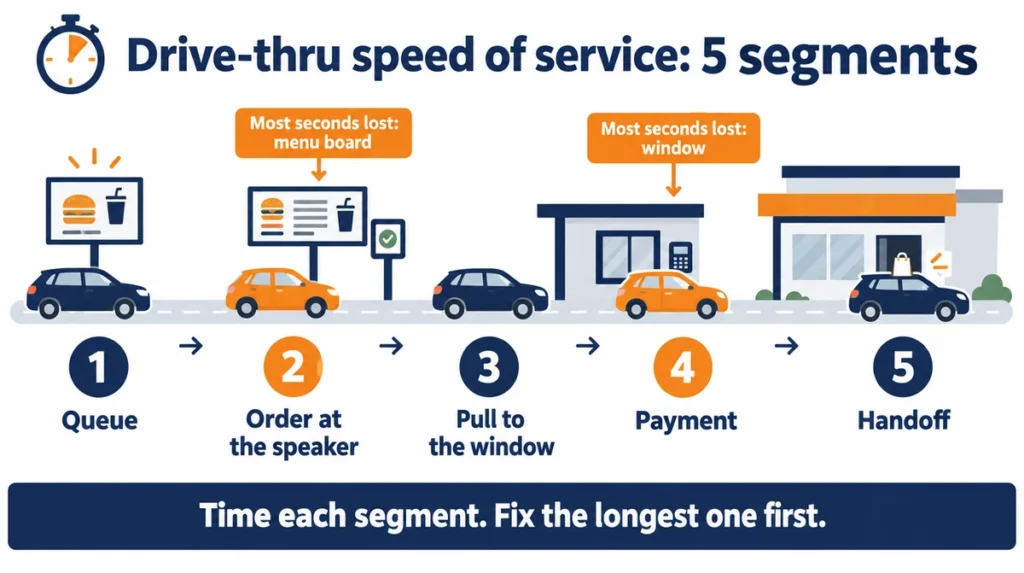
At the board:
- Fewer items on the main panel, larger combos, and prices readable from the driver’s seat.
- A pre-sell board in the queue, so guests decide before they reach the speaker. QSRs with digital boards can switch that panel by daypart.
- A confirmation screen at the speaker. Intouch Insight found one present on only 44.4% of visits in 2026, and only half of primary menu boards were digital.
- A board version for each daypart. QSR digital menu boards can take each store’s own POS prices and switch on schedule.
At the window:
- Take payment before the window, or with handhelds in the lane; Chick-fil-A crews take orders on tablets in the line at peak.
- Pull long orders forward to a waiting spot so the lane keeps moving.
- Give mobile orders their own lane or pickup point.
- Suggest one add-on after the guest finishes ordering, not during the greeting. Suggestive selling appeared on 51.6% of QSR drive-thru visits in 2026, down from 57.5% in 2025.
Wondering how to improve drive thru speed of service without new construction? Start with the segments above: board, speaker and window changes cost less than a second lane.
“The kitchen is the bottleneck” is the first guess and often the wrong one. In 2026 the median drive-thru visit took under 4:25, yet the slowest 10% took 9:56 or longer. Time all five segments before you change the kitchen, because a tail that long often builds up behind one slow order at the speaker or the window.
Drive-Thru Times: What Good Looks Like
Drive thru times in 2026 clustered around four and a half minutes, with a long tail of slow visits that hurts satisfaction far more than the average suggests.
| Measure (Intouch Insight, 2026, 13 US chains) | Result |
|---|---|
| Median visit | Under 4:25 |
| Slowest 10% of visits | 9:56 or longer |
| Fastest brand | Tim Hortons, 4:20 average |
| Slowest brand | Chick-fil-A, 7:06 average |
| Satisfaction when lane flow felt smooth | 97.1% |
| Satisfaction when lane flow felt frustrating | 42.9% |
Chick-fil-A had the longest average time and still scored 98% on satisfaction, which points to flow: a long lane that keeps moving feels better than a short one that stalls. Track your own median and slowest 10% rather than the average, because one 12-minute visit hides behind ten 4-minute ones. Improving drive thru speed means shrinking that tail first. Beyond the lane, the next constraint is the crew itself.
Restaurant Employee Turnover in QSRs
Restaurant employee turnover hits operations before it hits HR, because every new hire slows the line until they learn the station. In multi-unit QSRs, turnover shows up as longer ticket times, more remakes and managers working the line instead of running the shift.
The pressure behind QSR turnover is national. In August 2026, 3.5% of accommodation and food services workers quit in a single month, the highest quits rate of any industry, against 2.1% for private industry as a whole, according to the Bureau of Labor Statistics. A year earlier, the rate was 3.9%. QSRs also compete for the same hourly workers as retail, which had the next-highest quits rate at 3.0%.
Restaurant Turnover Rate: Industry Numbers and the Formula
A restaurant turnover rate equals the number of employees who left in a period, divided by the average number on staff, times 100. For example, a store averages 40 crew members over a year and 54 of them leave: 54 ÷ 40 × 100 = 135%, so the store replaced its whole crew more than once.
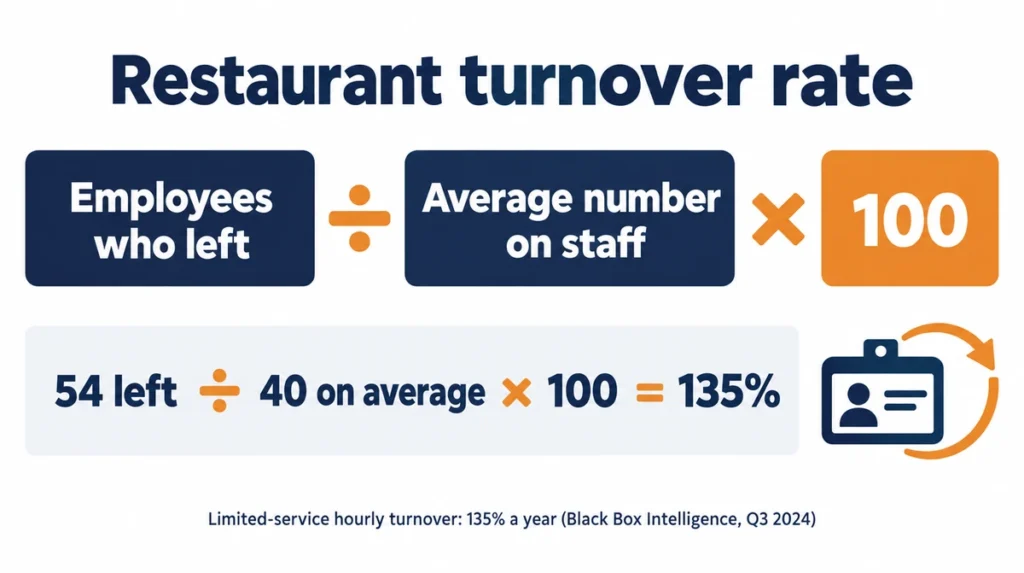
That example sits close to the industry. Black Box Intelligence data, cited in Fountain’s 2025 QSR Workforce Snapshot, put hourly turnover in limited-service restaurants at 135% a year in the third quarter of 2024, down from about 173% in 2022. The turnover rate in restaurant industry terms is far above most sectors, so compare your restaurant employee turnover rate with your own last year and with your best store, not with an office business. Split the number by role and by tenure: a 135% rate driven by people who leave in their first 90 days needs a different fix from one driven by shift leads who leave after two years.
How to Reduce Restaurant Employee Turnover
To reduce restaurant employee turnover in a QSR, focus on the first 90 days, predictable schedules and a visible path to shift lead.
- Onboarding: one trainer per new hire, one station at a time, and check-ins at day 7, 30 and 90. Keep a new hire on one station until they can run it at peak, then add the next.
- Schedules: post them at least two weeks ahead. Fair workweek laws already require 14 days’ notice for covered restaurant chains in New York City (fast food), Chicago, Philadelphia and Seattle, and statewide in Oregon. Fountain’s 2025 report says 70% of applicants find unpredictable scheduling raises their stress.
- Growth: a written path from crew to trainer to shift lead, with the pay step for each.
- Recognition: post speed and accuracy wins by shift, not only by store.
- Fewer chores: remove tasks that repeat every shift and do nothing for guests, such as re-exporting menu images or retyping delivery orders.
Beyond keeping people, a chain also has to keep its stores consistent.
How to Streamline QSR Operations Across Locations
To streamline QSR operations across locations, run every store on the same menu, prices, standards and screens, and set up reports that show when one store drifts. QSR operations execution usually breaks between the head office and the store, not inside the playbook.
- Standards: a station playbook, opening and closing checklists, and a monthly audit or mystery shop.
- Menu: one template at brand level, with local prices where the market needs them.
- Reports: speed, accuracy and labor by store, with the best and worst store compared every week.
- Franchise rules: QSRs with franchise stores need to write down what the brand sets (items, layout, standards) and what the franchisee can change (local prices, staffing).
Streamlining restaurant operations across a chain also covers the screens. A menu board that froze at 6 a.m. or lost its HDMI input can still show as delivered in a content system. Decker Verifier is an independent device beside each screen: it logs uptime, restarts a frozen player or display, and switches a lost input back. For brands that run menu boards, promo screens and pickup displays in every store, QSR digital signage brings those screens into one account, and Decker Verifier reports which of them actually show content.
In chains of QSRs, fast food chain efficiency improvement often stalls on a simple gap: the brand changes a price, and three stores still show the old one a week later. Fast food efficiency across a network depends on the boring parts, such as prices, files and screens, working the same way everywhere. That is how you streamline restaurant operations at chain scale.
“A price change at head office reaches every store by itself” rarely holds. Unless each board reads prices from that store’s POS, someone has to update and publish files store by store, and the stores that miss the change keep selling at the old price.
Restaurant Efficiency Metrics to Track Every Week
Track five restaurant efficiency metrics every week, store by store, and compare each one with the week before you changed anything.
| Metric | Source | How often |
|---|---|---|
| Speed of service by segment | Drive-thru timer, POS timestamps | Daily at peak, reviewed weekly |
| Order accuracy | Complaints, remakes, refunds | Weekly |
| Labor % of sales by daypart | POS sales and the schedule | Weekly |
| 90-day turnover | HR records | Monthly |
| Screen uptime and menu accuracy | Screen monitoring reports | Weekly |
Check each number with the store manager, and keep the review short enough to run every week. Read the five together. Faster service with falling accuracy does not count as progress, and lower labor cost with longer ticket times only moves the cost to the guest. Restaurant operational efficiency comes from the combination, not from any single line. Next, set up one store and compare its week with the rest of the chain.
See Every Store’s Menu on One Schedule.
Connect one store’s menu boards, schedule its dayparts and sync prices and sold-out items from the POS. In addition, POS price and stock sync comes with the Professional plan. Start with Decker
When These Fixes Won’t Speed Up a QSR
These practices will not fix a store whose bottleneck is kitchen capacity: if one fryer has to serve a peak that needs two, no board or schedule closes the gap. Segment timing tells you little in a store that sees fewer than 20–30 guests or cars in its busiest hour, because a handful of visits cannot show a pattern. A store that will close or move within three months will not repay new standards, screens or training. Syncing sold-out items across screens adds little for a counter with no drive-thru and a menu that changes less than once a quarter, where a printed board stays accurate. Any automation also needs a stable internet connection, or at least a player that keeps showing the menu from a local cache when the connection drops. Overall, the takeaways below hold for every other store.
Key Takeaways: How to Improve QSR Operations
Change one variable at a time, and judge every change by speed, accuracy, labor and consistency together.
- Time service in segments, and fix the longest segment first.
- Improve drive-thru speed at the board and the window before you look at the kitchen.
- Cut errors with confirmation screens and required modifiers in the POS.
- Staff peaks by forecast, shorten the peak menu, and keep sold-out items in sync on every screen.
- Treat the first 90 days and predictable schedules as the core of retention.
- Run every store to one standard, and check that every screen actually shows the menu.
Next come the sources behind the numbers in this guide.
Questions and Answers
1 What are some strategies to improve restaurant operations?
Pick the weakest of four metrics: speed of service, order accuracy, labor or consistency. Change one thing that drives it, then compare two weeks before and after. That is the most reliable way to improve QSR operations without guessing, and most stores start with drive-thru or counter timing because it shows where the seconds go.
2 What is speed of service in a restaurant?
Speed of service is the time from a guest’s first contact, such as joining the line or the lane, to food in hand. In a QSR you time it in segments, such as queue, order, payment and handoff, to see which one runs slow.
3 Is it faster to go through the drive-thru?
Often, but not always. Intouch Insight’s 2026 study put the median drive-thru visit under 4:25, yet the slowest 10% of visits took 9:56 or more. A short counter line, or a mobile order with an accurate ready time, can beat a long lane.
4 What is the 30/30/30 rule for restaurants?
It is a budgeting rule of thumb: about 30% of sales to food, 30% to labor and 30% to overhead, which leaves about 10% as profit. Treat it as a starting point, not a standard, because format, rent and menu shift the split. Compare it with your own P&L by store.
5 What are some examples of operational improvements in a restaurant?
Common examples are a pre-sell board in the drive-thru queue, required modifiers in the POS, a confirmation screen at the speaker, a shorter lunch menu, schedules built on 15-minute forecasts, a 90-day onboarding plan, and menu boards that remove sold-out items on their own.
6 Are restaurants struggling in 2026?
Many are. In the National Restaurant Association’s 2026 report, 42% of operators said their restaurants were not profitable in 2025, and 60% reported lower traffic than a year earlier. Operators also expected higher food and labor costs to keep pressure on margins.
7 What is the biggest problem in the restaurant industry?
Rising food and labor costs combined with falling traffic, according to the National Restaurant Association’s 2026 report. Inside a QSR, labor is where those pressures meet: accommodation and food services had the highest quits rate of any industry in August 2026.
8 What is a good turnover rate for a restaurant?
There is no official benchmark. For QSR hourly crews, Black Box Intelligence data put limited-service turnover at 135% a year in the third quarter of 2024, so a store at 15–20% a year sits far below the industry. Rather than chase one number, track 90-day and 12-month turnover by store and aim to beat your own last year and your chain average. Use the same formula every time, so you can see whether the changes work.
9 How do you reduce employee turnover in fast food?
Focus on the first 90 days, post schedules two weeks ahead, train one station at a time and show a clear path to shift lead. In addition, remove chores that repeat every shift without helping guests.
Sources
- Intouch Insight: 2026 Drive-Thru Study
- U.S. Bureau of Labor Statistics: Quits rate 3.5 percent in accommodation and food services
- National Restaurant Association
- Restaurant Dive: Wingstop Smart Kitchen in 1,000 restaurants
- Nation's Restaurant News: McDonald's ends its AI drive-thru test with IBM
- Fountain: QSR Workforce Snapshot